Victor Adedero

Data Analyst with 3+ years of experience transforming data into actionable insights. Skilled in Microsoft Excel for automation and reporting, SQL for data extraction and analysis, and Power BI for building interactive dashboards.
Data Analysis Portfolio
PROJECT 1
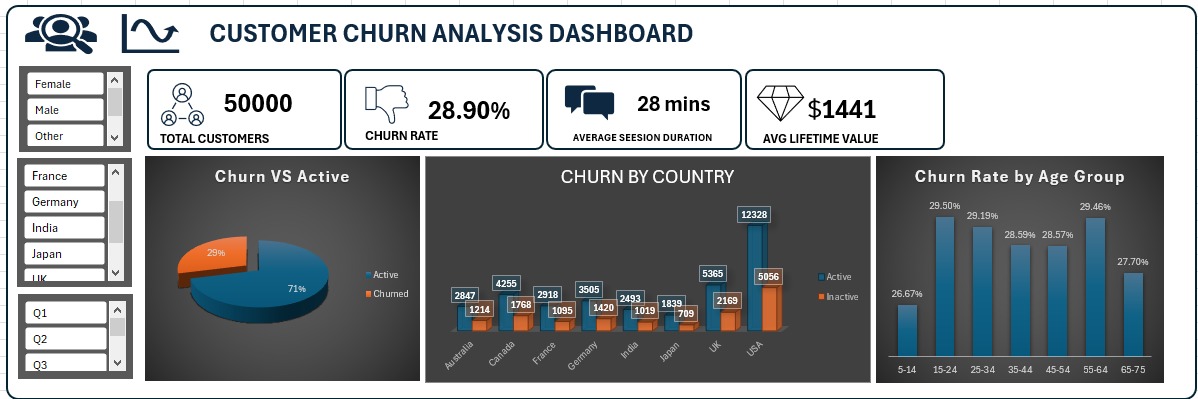
📊 Customer Churn Analysis Dashboard
🔍 Project Overview
Customer churn is a major challenge for businesses, as losing customers directly impacts revenue and growth.
This project analyses customer data to identify churn patterns, understand customer behaviour, and highlight key risk factors.
🛠️ Tools Used
- Microsoft Excel
- Pivot Tables
- Slicers
- Data Cleaning & Transformation
📈 Key Metrics
- Total Customers: 50,000
- Churn Rate: 28.9%
- Average Session Duration: 28 Mins
- Average Lifetime Value: $1441
💡 Key Insights
- The churn rate is relatively high (~29%), indicating a potential retention issue.
- Churn is consistent across countries, suggesting the problem is systemic rather than location-specific.
- Younger customers show slightly higher churn rates compared to older groups.
- With an average lifetime value of $1441 per customer, churn represents a significant revenue loss.
📊 Dashboard Features
- Interactive filters (Gender, Country, Signup Quarter)
- KPI overview for quick performance tracking
- Visual breakdown of churn distribution
- Regional and demographic churn analysis
📁 Dataset
The dataset used represents e-commerce customer behaviour, including demographics, engagement, and churn indicators.
🖼️ Dashboard Preview
🚀 Conclusion
This dashboard provides a clear overview of customer churn patterns and highlights areas where businesses can focus their retention strategies to improve long-term profitability.
PROJECT 2
📊 Sales & Profit Performance Dashboard
🔍 Project Overview
This project analyses retail sales data to evaluate business performance across regions, product categories, customers, and shipping methods.
The goal is to identify:
- Revenue drivers
- Profitability gaps
- High-value customers
- Operational inefficiencies
The dashboard provides an interactive way to explore trends and uncover insights that support data-driven decision-making.
🛠️ Tools Used
- Microsoft Excel
- Pivot Tables & Pivot Charts
- Slicers (Year, Month, Category)
- Data Cleaning & Aggregation
- KPI Design & Dashboard Layout
📈 Key Metrics
- Total Sales: $2,297,201
- Total Profit: $286,397
- Profit Margin: 12.47%
💡 Key Insights
1. Profitability is Uneven Across Categories
- Technology generates the highest profit contribution
- Furniture shows weaker profitability despite strong sales
👉 This suggests cost inefficiencies or heavy discounting in Furniture.
2. Sales Are Concentrated in Key States
- A small number of states (e.g., California, New York) dominate total sales
- Several states contribute significantly less
👉 The business is geographically dependent on a few strong markets, increasing risk.
3. High Sales ≠ High Profit
- Some high-sales areas or products do not translate into high profit
👉 Indicates:
- Excessive discounting
- High operational/logistics costs
4. Customer Revenue is Highly Skewed
- A small group of customers contributes a large portion of profit
👉 Opportunity:
- Focus on customer retention strategies for top clients
5. Shipping Mode Impacts Order Volume
- Standard Class dominates order quantity
- Faster shipping modes are used significantly less
👉 Suggests:
- Customers are price-sensitive rather than speed-sensitive
- Opportunity to optimise logistics costs
📊 Dashboard Features
- KPI summary (Sales, Profit, Margin)
- Time-based analysis (Profit by Year)
- Geographic performance (Sales by State & City)
- Customer-level insights (Top 5 Customers)
- Category performance breakdown
- Operational view (Shipping Mode distribution)
Interactive Filters:
- Year
- Month
- Category
📁 Dataset
The dataset used is the Superstore Sales dataset, containing:
- Order details
- Customer information
- Product categories
- Sales, profit, and discount data
- Shipping and regional data
🖼️ Dashboard Preview
🚀 Business Recommendations
1. Improve Furniture Profitability
- Review pricing and discount strategy
- Reduce cost of goods or logistics where possible
2. Reduce Over-Reliance on Key Regions
- Expand marketing in underperforming states
- Identify barriers to sales in low-performing regions
3. Optimise Discount Strategy
- Investigate products with high sales but low profit
- Implement controlled discounting
4. Focus on High-Value Customers
- Introduce loyalty or retention programs
- Personalised offers for top contributors
5. Leverage Cost-Efficient Shipping
- Promote Standard Class where appropriate
- Analyse cost vs speed trade-offs
🧠 Skills Demonstrated
- Data Analysis & Interpretation
- Business Insight Generation
- Dashboard Design (Excel)
- KPI Development
- Stakeholder-Oriented Thinking
PROJECT 3
SQL-PROJECT
TITLE: Workplace Safety Incident Analysis using SQL
SQL CODESsales data
Skill Used:Data Retrieval (SELECT): Queried and extracted specific information from the database. Data Aggregation (SUM, COUNT): Calculated totals, such as sales and quantities, and counted records to analyze data trends. Data Filtering (WHERE, BETWEEN, IN, AND): Applied filters to select relevant data, including filtering by ranges and lists.
Business Context
A manufacturing company is experiencing increasing workplace incident costs across multiple plant locations.
The operations team has requested a data analysis to:
- Identify high-risk locations
- Understand cost drivers
- Highlight severe incidents
- Support safety improvement decisions
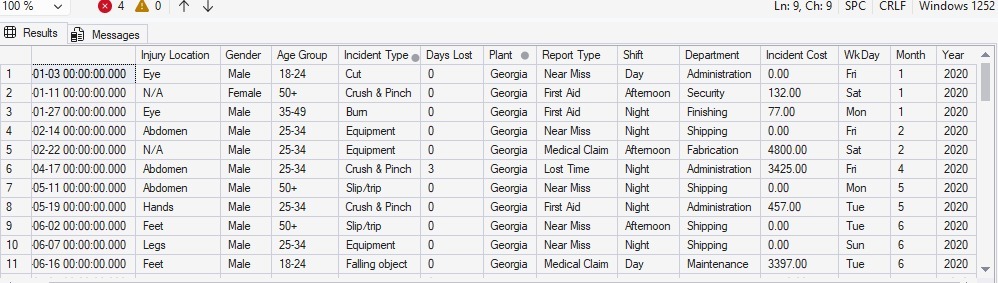
Dataset
Workplace Safety Data
Key fields include:
- Date
- Injury Location
- Gender
- Age Group
- Incident Type
- Days Lost
- Plant
- Report Type
- Shift
- Department
- Incident Cost
- WkDay
- Month
- Year
SQL Questions and SQL Solutions
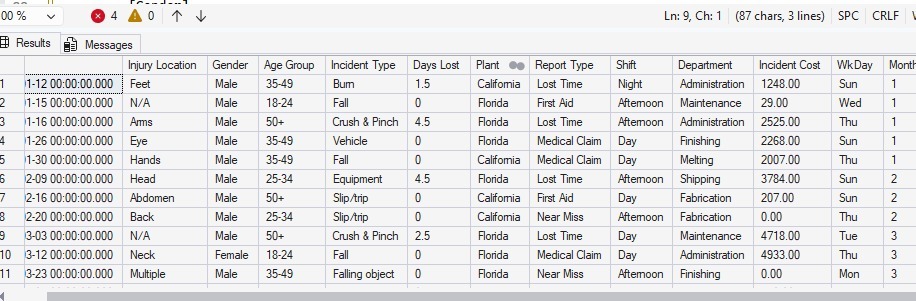
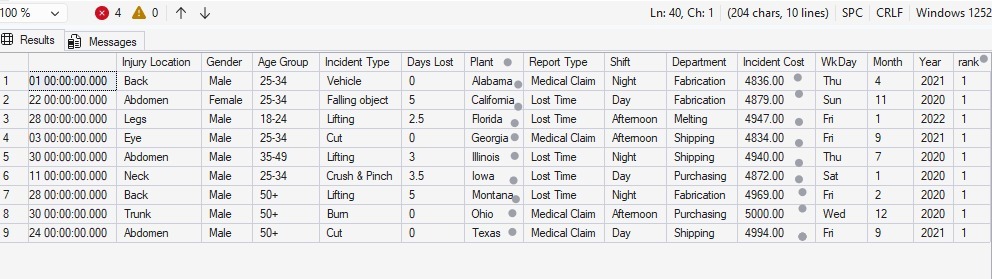
1. Identify all incidents that occurred in the Georgia plant
SELECT *
FROM [dbo].['Workplace Safety Data$']
WHERE PLANT='GEORGIA'
🖼️Preview
 —
—
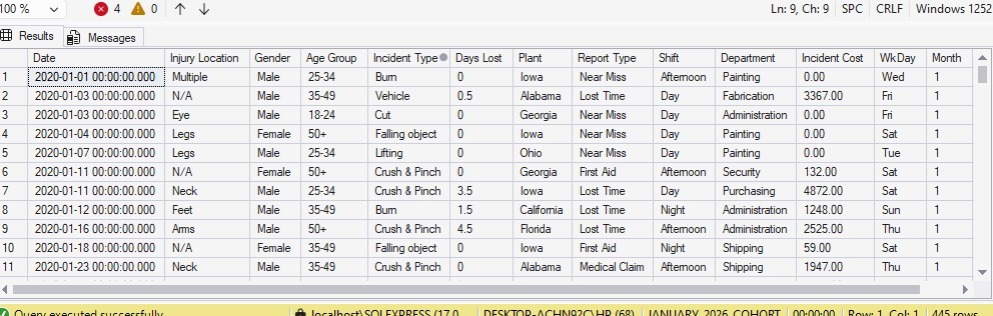
2. Retrieve incidents that are not classified as FALL-related
SELECT *
FROM [dbo].['Workplace Safety Data$']
WHERE [INCIDENT TYPE] <> 'fall'
🖼️Preview
3. Analyze incidents in key operational locations (California and Florida)
SELECT *
FROM[dbo].['Workplace Safety Data$']
WHERE PLANT IN ('CALIFORNIA','FLORIDA')
🖼️Preview
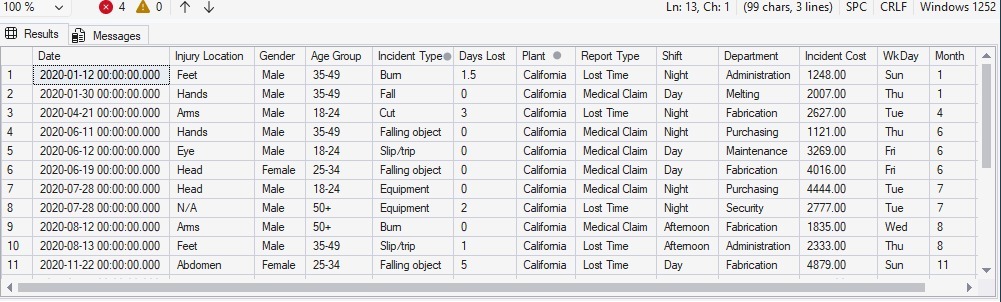
4. Identify high-cost incidents in California (cost greater than 1000)
SELECT *
FROM[dbo].['Workplace Safety Data$']
WHERE PLANT = 'CALIFORNIA' AND [INCIDENT COST]>1000
🖼️Preview
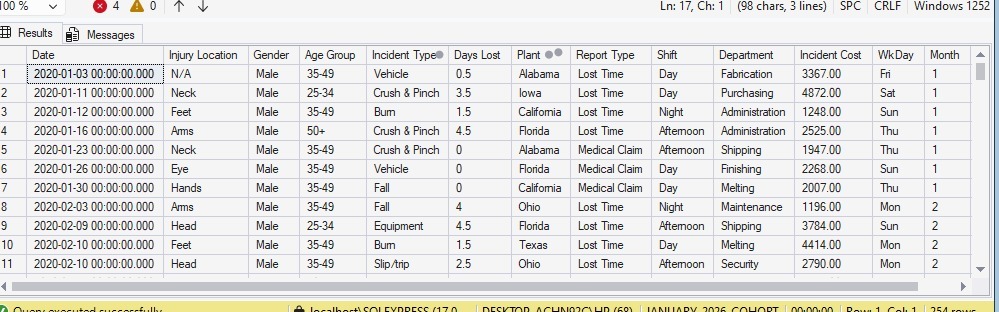
5. Identify incidents based on either location(CALIFORNIA) or cost condition(>1000)
SELECT *
FROM[dbo].['Workplace Safety Data$']
WHERE PLANT = 'CALIFORNIA' OR [INCIDENT COST]>1000
🖼️Preview
 —
—
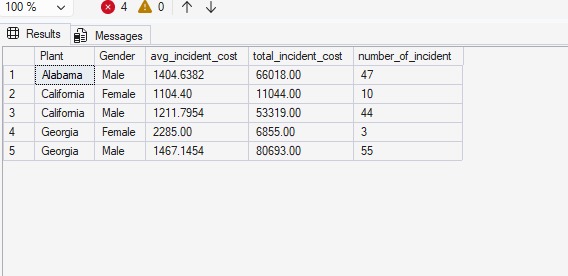
6. Calculate average, total, and count of incident costs by plant and gender in the following plants (ALABAMA CALIFORNIA GEORGIA)
select [Plant]
  ,[Gender]
  ,avg([Incident Cost]) as avg_incident_cost
  ,sum([Incident Cost]) as total_incident_cost
  ,count(*) as number_of_incident
  from[dbo].['Workplace Safety Data$']
  group by [Plant]
          ,[Gender]
  having plant in ('alabama','california','georgia')
 order by[Plant] asc
🖼️Preview
 —
—
7. Identify the highest-cost incident in each plant
with incident_rank as
(
select *
       ,rank () over( partition by[Plant] order by [Incident Cost] desc) as rank
from[dbo].['Workplace Safety Data$']
)

select*
from incident_rank
where rank=1
🖼️Preview
 —
—
Key Insights
- Some plants generate significantly higher incident costs than others
- High-cost incidents are concentrated in specific locations
- Gender-based patterns exist in incident distribution
- Categorizing incidents helps prioritize safety improvements
Tools Used
- SQL Server
- Excel (data preparation)
Conclusion
This project demonstrates the use of SQL to analyze workplace safety data and extract meaningful business insights. By applying filtering, aggregation, window functions, and conditional logic, key patterns in incident occurrence and cost distribution were identified.
The analysis highlights that incident costs vary significantly across plants and demographic groups, with certain locations consistently showing higher risk levels. High-cost incidents were successfully isolated and ranked, providing visibility into the most critical safety concerns.
Overall, this project shows how SQL can be used not just for querying data, but for supporting data-driven decision-making. The insights generated can help organizations prioritize safety improvements, reduce incident costs, and enhance operational efficiency.
PROJECT 4
POWER BI-PROJECT
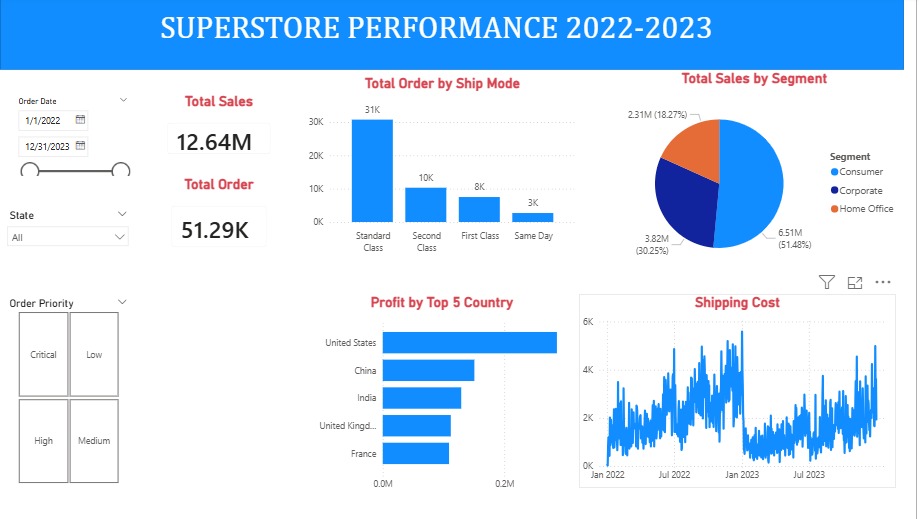
📊 Superstore Sales Performance Dashboard Power BI
🔍 Project Overview
This project analyzes retail sales performance using Power BI, focusing on revenue, order volume, profitability, and shipping trends across different customer segments and regions.
The dashboard provides an interactive view of business performance between 2022 and 2023, enabling stakeholders to identify key trends and make data-driven decisions.
🎯 Objectives
- Track total sales and order volume
- Analyze sales distribution by customer segment
- Evaluate shipping methods and associated costs
- Identify top-performing countries by profit
- Monitor trends over time
📌 Key Metrics
- Total Sales: 12.64M
- Total Orders: 51.29K
📈 Dashboard Features
- Dynamic date range filtering
- Sales breakdown by segment (Consumer, Corporate, Home Office)
- Order distribution by shipping mode
- Profit comparison across top countries
- Shipping cost trend analysis over time
- Interactive slicers for State and Order Priority
🧠 Key Insights
- The Consumer segment generates the highest revenue, contributing over 50% of total sales
- Standard Class shipping dominates order volume, indicating cost preference over speed
- The United States leads significantly in profit compared to other countries
- Shipping costs show high variability, suggesting inconsistent logistics expenses
- Lower priority orders are more frequent, indicating potential operational optimization opportunities
🛠 Tools Used
- Power BI (Data Modeling, DAX, Visualization)
- Power Query (Data Cleaning & Transformation)
📷 Dashboard Overview
🚀 Business Value
This dashboard enables stakeholders to:
- Identify high-value customer segments
- Optimize shipping strategies
- Improve profitability by region
- Monitor operational efficiency
📬 Contact victor36629@gmail.com
If you’d like to collaborate or discuss this project, feel free to connect.